Grafana Labs

Observability Survey

2024

Key findings and analysis on the state of observability

Introduction

Observability has become an integral part of how many organizations build and maintain their systems, helping to improve performance, reduce toil, and save money through better resource utilization. However, these outcomes aren’t guaranteed, and many teams still struggle to adapt to the complexity of this evolving space.

To better understand where organizations are in their observability journeys — as well as the wins and losses that have come as a result — we solicited feedback from the community for our second annual Grafana Labs Observability Survey. We heard from more than 300 industry practitioners who shared their experiences, helping to provide an intriguing snapshot of where the industry is today and where it’s headed.

In this report, you’ll find a breakdown of the survey results, which point to a maturing market where teams are juggling dozens of tools and data sources. You’ll also see that open standards have emerged as a means to address this complexity, while at the same time, teams continue to push for more automation and accountability.

Survey snapshot

79%
of organizations with centralized observability have saved time or money
70%
of teams use four or more observability technologies
62
different observability technologies cited by respondents as currently in use
61%
of respondents cited cost or unexpected bills as one of their biggest concerns about observability
98%
of respondents use open source observability tools

Most used observability technologies

Top observability technologies
Section 1

5 key takeaways

observability practices are still maturing

Observability practices are still maturing

We gauged where respondents are in their observability journeys by asking which approach they took: reactive, proactive, or systematic. (The categories represent a range of observability approaches, from least mature to most mature. Read more on the category breakdown in the next section.)  A little over half say their organization has taken a proactive approach, which points to the growth in this space. However, organizations are still more likely to be reactive than systematic, which means they often hear about problems from their customers rather than have systems in place to address issues before their users ever find out.
tool and data sprawl remains a major hurdle

Tool and data sprawl remains a major hurdle

More than two-thirds of teams use at least four observability technologies, with respondents collectively citing 60+ technologies currently in use. In addition, half of Grafana users say they have at least six different data sources configured and actively in use in Grafana. The sheer volume of tools and data sources can translate to considerable complexity and overhead, so it’s no wonder 79% of those who have centralized observability have saved time or money.
open source is the de facto standard

Open source is the de facto standard

We cater to a vibrant open source community at Grafana Labs. And while that likely skews the results in our survey, there’s no denying the impact of OSS. An overwhelming majority of respondents are investing in Prometheus (89%) or OpenTelemetry (85%). Almost 40% of respondents use both in their operations, and more than 50% increased their usage of each project over the past year.
AI could play a big role — eventually

AI could play a big role — eventually

AI is getting tons of attention these days, but its role in observability is largely aspirational at this point. Still, observability practitioners remain excited about its potential to accelerate incident response and simplify observability adoption. Anomaly detection is the most cited AI-enabled feature respondents say they would like to see, with more than three-quarters calling it out.
cost emerges as a top concern

Cost emerges as a top concern

More than half of respondents say cost is their biggest concern about observability, while other related topics — cardinality, unpredictable bills, and vendor lock-in — are also cited.
Section 2

The continued (uneven) maturation of observability

No longer a niche topic, observability is a vital part of the software development lifecycle for many organizations today. However, not everyone is at the same stage of adoption, and organizations with less mature strategies are struggling to reap the benefits.
more organizations have centralized observability

More organizations have centralized observability

Mature organizations tend to have a “single pane of glass” view of all their systems and data. 76% of all respondents say their organization has centralized observability, compared to 70% last year. Even in the sector that is the furthest behind in this regard, energy and utilities, 63% say they have centralized their efforts.
centralized observability saves time and money

Centralized observability saves time and money

Among those with centralized observability, 79% say it has resulted in time or cost savings. When asked for specifics, the most common response was a reduction in mean time to repair (MTTR), lower vendor fees and operational costs, and improved processes and performance.

If your organization has centralized observability, has that led to time/cost savings?

Time and cost savings

By industry

Software and technology
Financial services
Retail/e-commerce
Telecommunications
Energy and utilities

Helping teams instrumenting and storing observability data means that they can spend more time focusing on their core tasks.

- Respondent from a large European technology company on the benefits of centralized observability

Few organizations take a systematic approach

Organizations are more likely to take a reactive approach to observability (least mature) than a systematic approach (most mature), though most fit in the middle ground and take a proactive approach. (Check out our Observability Journey Maturity Model for more on these designations.) The very largest companies (5,000+ employees) are the most likely to take a systematic approach (28%).

Which best describes the maturity of your organization’s current observability efforts?

24%

Reactive:

Customers are bringing you problems before you know about them. Time is spent responding to issues reported by users.

57%

Proactive:

You work to develop procedures and implement tools to know about issues before your users do. You are able to prevent issues from impacting customers some of the time.

19%

Systematic:

You develop procedures and implement tools to know about issues before your users do, and are able to minimize impact to users. Observability and performance testing are implemented early in the SDLC, preventing issues from occurring in production.


accountability still lags behind

Accountability still lags behind

More mature organizations rely on SLOs for data-driven accountability. Only 26% of respondents are actively using SLOs in production, though 49% say they’re more relevant than they were last year. Large and small businesses greatly diverged in this area, with 55% of large orgs either using SLOs in production or building POCs, compared to just 28% of small businesses.
application observability is on the rise

Application observability is on the rise

The incorporation of app performance into overall observability efforts is another indicator of a mature organization, but only 41% are actively doing it. Still, 53% say it’s more relevant than last year. This is another area where large businesses are more likely to have adopted it.

The more mature an organization’s observability strategy, the better the results

Saved time/money with centralized observability
Section 3

So. Many. Tools.

The distributed nature of today’s applications is a major part of the shift from monitoring to observability. Organizations are tracking more services and relying on more data sources, and they’re using scores of tools to do so. It’s no wonder more organizations are centralizing observability.

What observability technologies* does your group use?

Observability technologies
*Respondents could pick multiple technologies

Teams rely on lots of data sources …

Among active Grafana users, 72% have at least four data sources configured in Grafana, which is up slightly from last year (68%). Amazingly, one in 10 users pulls in data from more than 50 sources — that group is also the most likely to centralize observability (80% compared to 60% overall). The financial services and tech sectors were much more likely to have 50 or more data sources in Grafana, at 30% and 21%, respectively.

How many data sources do you/your group have configured in Grafana and actively use?

Data sources configured in Grafana

… and lots more tools

Astonishingly, respondents cite more than 60 different technologies when we asked what they are using in their groups, a sign of the still-evolving nature of this market. On top of that, 89% of groups use between two and 10 observability technologies, and 15% of respondents say they use even more than 10 across their entire company. Moreover, the number of groups using four or more technologies grew slightly this year, from 66% to 70%.

How many observability technologies are you using?

How many observability technologies are you using?

Company size and industry make a difference

The bigger the company, the more tools and data sources they use. This is especially the case at the far ends of the spectrum. For example, only 16% of companies with 10 or fewer employees have more than 10 data sources configured in Grafana, compared to 39% of companies with more than 5,000 employees.

Six or more data sources

31%
Small businesses
49%
Mid-sized businesses
54%
Large businesses

Six or more observability technologies (group)

22%
Small businesses
36%
Mid-sized businesses
44%
Large businesses

Six or more observability technologies (company)

31%
Small businesses
50%
Mid-sized businesses
61%
Large businesses
There are also notable differences between industries. For example, telecommunications companies tend to use fewer observability technologies in their group (16% use six or more, compared to 35% overall), while the financial services (30%) and tech (21%) sectors are much more likely to have 50 or more data sources in Grafana (10% overall).

We achieved a remarkable 34% reduction in MTTR, enhancing system reliability and streamlining operational processes, leading to a 29% decrease in overall overhead.

- Respondent from a small Asian software company on the benefits of centralized observability

Correlating data has multiple benefits

One of the good things about collecting all that data is the ability to correlate infrastructure data with data relevant to other departments. While the vast majority of respondents (81%) say they correlate data for software development, other departments are cited as well, including finance, support, marketing, and sales. Respondents say resource efficiency is the biggest benefit of this type of data correlation.

If you correlate data in this manner, what value* do you get from it?

What value do you get from correlating infrastructure data with data relevant to other departments?
Section 4

OSS is the de facto approach to observability

The nature of our community certainly skews the results of this survey in favor of open source software, but it’s hard to ignore just how much OSS underpins the observability space today. Though there are lots of OSS tools available, including our own, we focused our questions on the emergence — and interplay — of Prometheus and OpenTelemetry as more users seek open standards as a means to make all their tools and data work together.

8 of the top 10

Top 10 observability technologies

Are you using observability tools under an open source or a commercial license?

32%
Open source only
38%
Mostly open source
20%
Roughly equal: open source and commercial
8%
Mostly commercial
2%
Commercial only

Prometheus remains a mainstay of observability

Three-quarters of survey respondents say they’re using Prometheus in production today, with another 14% looking into it. The open source monitoring system is more than 10 years old and has become the de facto standard. It doesn’t appear to be going anywhere either, as just 3% say they used it less than they did a year ago.
Prometheus

How much have you invested in Prometheus?

Prometheus is a mainstay

How does your Prometheus usage today compare to a year ago?

How does your use of Prometheus compare to a year ago?

OpenTelemetry is on the rise

OpenTelemetry has emerged as another key OSS project — it’s now the second most active CNCF project, behind only Kubernetes. The percentage of respondents not using OpenTelemetry is fairly similar to Prometheus (15% vs. 11%), but the big distinction is where users are in their adoption (43% are investigating OpenTelelemetry, compared to 14% for Prometheus).
OpenTelemetry

How much have you invested in OpenTelemetry?

OpenTelemetry is on the rise

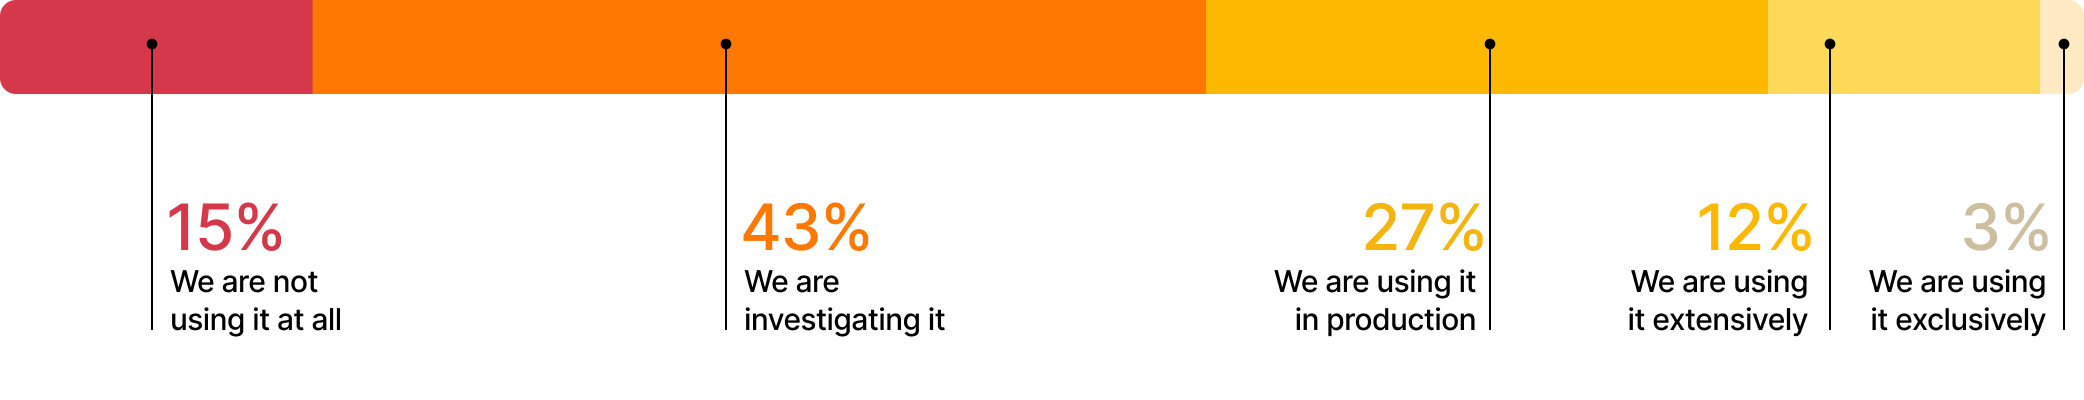
How does your OpenTelemetry usage compare to a year ago?

How does your use of Prometheus compare to a year ago?

It’s not either/or with Prometheus and OpenTelemetry

Though some see OpenTelemetry and Prometheus as competing technologies, organizations are making room for both. Nearly half of all Prometheus users also use OpenTelemetry, while the OpenTelemetry users are more likely to be actively using Prometheus than the average survey respondent (85% vs. 75%).
OpenTelemetry Prometheus

OpenTelemetry-Prometheus overlap

36%
of all respondents use Prometheus and OpenTelemetry in production
48%
of Prometheus users also use OpenTelemetry in production
40%
of Prometheus users are investigating OpenTelemetry
85%
of OpenTelemetry users also use Prometheus in production
7%
of OpenTelemetry users are investigating Prometheus

Open standards go hand in hand with many tools

Prometheus and OpenTelemetry users are juggling more observability technologies in their groups than the average respondent — 35% of overall respondents use more than five, compared to 41% of Prometheus users and 44% of OpenTelemetery users.
Section 5

What’s next: addressing gaps and driving innovation

The influx of data and technologies — and the still-developing nature of those technologies — is leading to some concerns among observability practitioners. However, there is considerable excitement about what’s to come.
Cost and complexity

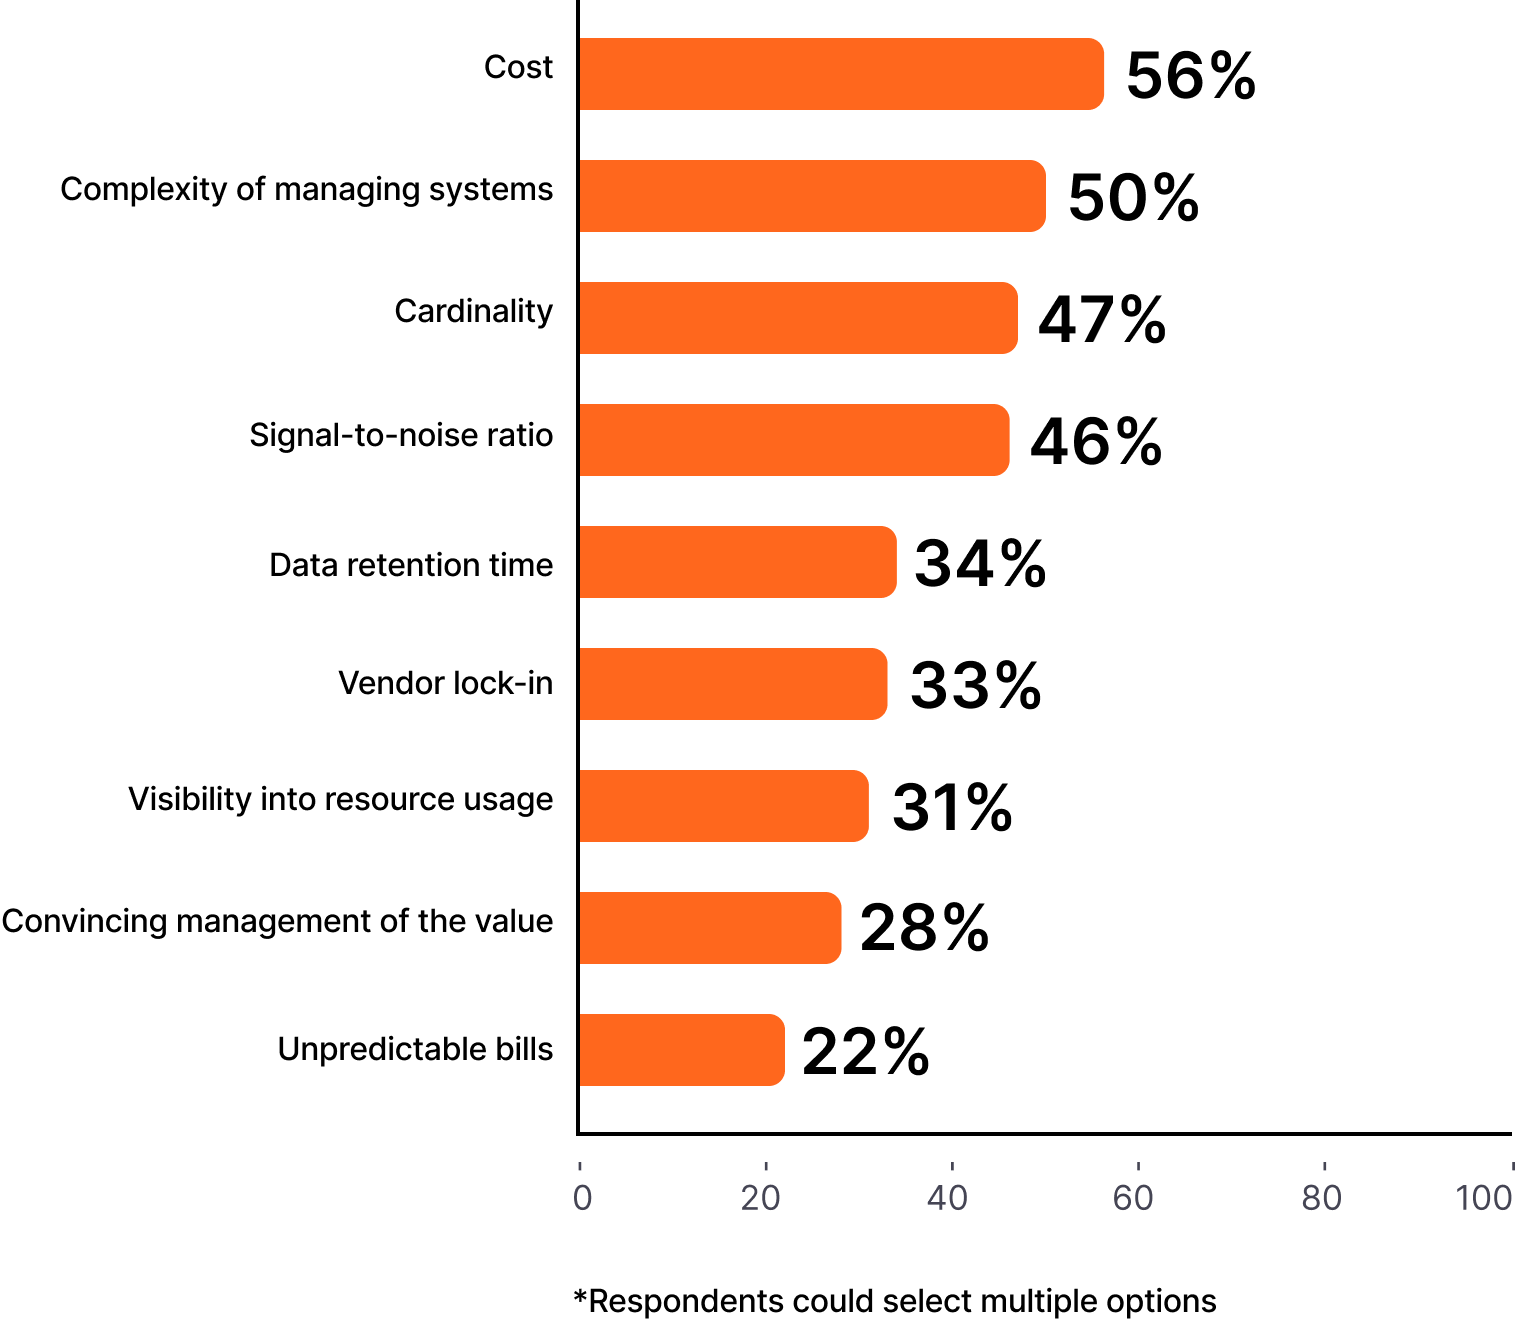
Cost, complexity still loom large

Cost is the most cited concern about observability in our survey, followed closely by complexity. However, a number of topics are also cited, including cardinality, signal-to-noise ratio, and data retention time.

Biggest concerns about observability*

Biggest concerns about observability
AI

AI could be a boon to observability automation and assistance

AI has the potential to help with much of the complexity that comes with observability, and despite some healthy skepticism, most respondents are eager to see what’s to come, with more than three-quarters saying they want to use it for anomaly detection, and roughly half see potential value in predictive insights, dashboard generation, query assistance, and automated incident summaries.

Which AI/ML-powered features* would be most valuable to your observability practice?

Data sources configured in Grafana
AI

Early days for observing AI

In another sign that AI for observability is still in its nascent days, only 7% of respondents say they’re using observability on AI systems and LLMs, while 46% say it’s not even on their radar.
AI

Excitement abounds for OSS, AI, and broader adoption

We asked an open-ended question to see what respondents are most excited about going forward, and the results are closely aligned with many of the topics already discussed in this report. AI and OSS are at the top of the list, while excitement for more mature aspects of observability (profiling, tracing, application observability) is also high.

Observability topics respondents are most excited about

1
OpenTelemetry
2
AI
3
Standardization/interoperability
4
eBPF
5
Profiling
6
Tracing
7
Signal/data correlation
8
Forecasting
9
Improved alerting
10
Application observability

The fourth most cited answer, eBPF, is another topic to keep an eye on going forward. While only 7% say they’re using the kernel-level technology in production, 42% say they’re talking about it or building POCs.

Finding ways to make onboarding easier would be great. There’s a lot of very interesting tech, but still such a knowledge barrier between those who get observability and those who don’t.

- Respondent from a large Asian media and entertainment company

Section 6

About the respondents and methodology

This year, 306 people participated in the Grafana Labs Observability Survey. We did not contract an outside agency to solicit responses. Instead, we reached out to our community to participate, through our website, social media, and at various Grafana Labs and OSS events.

What industry is your organization in?

Industry

What is the size* of your organization?

*For the purposes of simplicity in this report, we merged these to create the following designations in some places: small business (1-100 employees), mid-sized business (101-1,000 employees), large businesses (1,001+)
Size of organization
globe

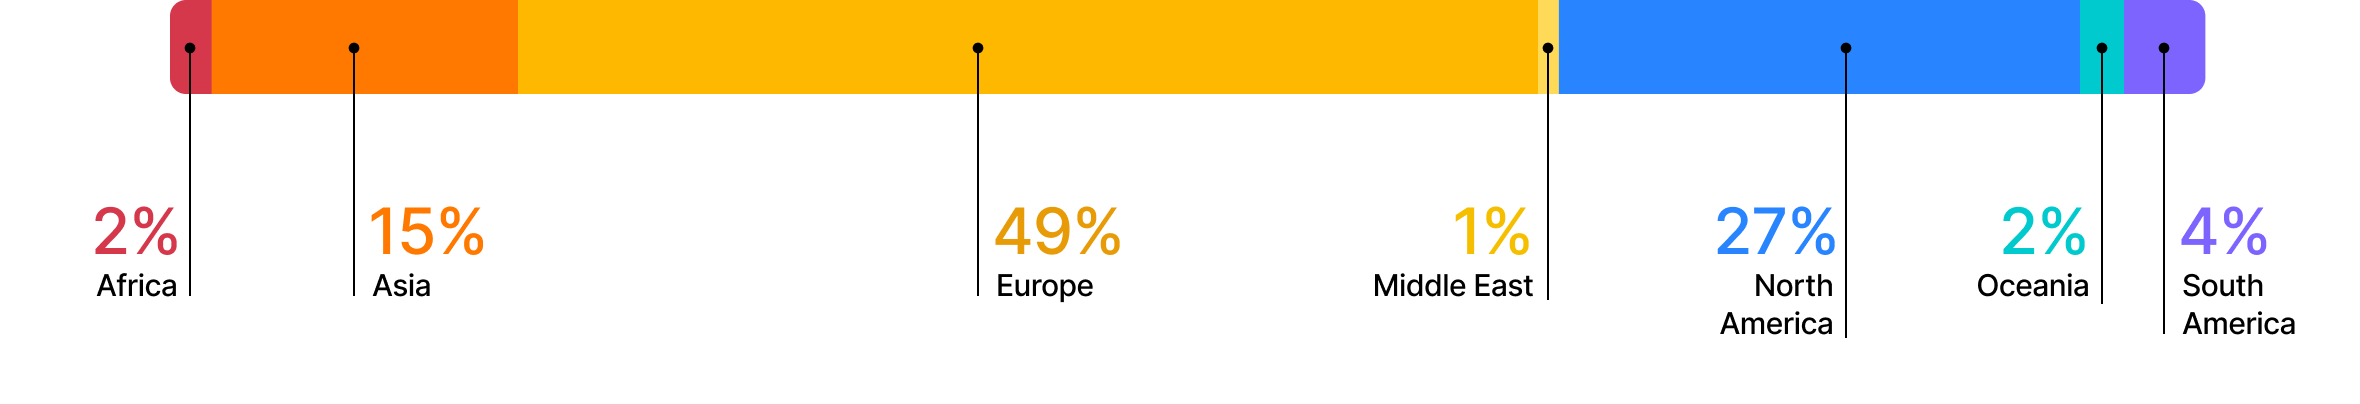
What region are you based in?

Region

Conclusion

On behalf of Grafana Labs, we want to thank those who participated in the survey as well as those who took the time to view the results. The open source community, our customers, our contributors, and our users are all integral to everything we do here, and your input shapes how we operate and improve our projects and products on a daily basis.

We’re excited to see how far observability has come and how organizations are putting these tools and techniques into practice around the globe and across different industries and organizations of all sizes.

Compare this information to last year’s survey results:
2023 Observability Survey Results

About Grafana Labs

Grafana Labs provides an open and composable monitoring and observability stack built around Grafana, the leading open source technology for dashboards and visualization. There are more than 3,000 Grafana Labs customers, including Bloomberg, Citigroup, Dell Technologies, Salesforce, and TomTom, and more than 20 million users of Grafana around the world. Grafana Labs helps companies manage their observability strategies with the LGTM Stack, which can be run fully managed with Grafana Cloud or self-managed with the Grafana Enterprise offerings, both featuring scalable metrics (Grafana Mimir), logs (Grafana Loki), and traces (Grafana Tempo) as well as extensive enterprise data source plugins, dashboard management, alerting, reporting, and security. Grafana Labs is backed by leading investors Lightspeed Venture Partners, Lead Edge Capital, GIC, Sequoia Capital, Coatue, and J.P. Morgan. Follow Grafana Labs on LinkedIn and X or visit https://grafana.com.