Why companies choose Grafana Cloud for their hosted observability platform
Three different businesses, one shared problem: SailPoint, Kushki, and Flexcity were all looking for a hosted solution to help them optimize their telemetry storage, gain more insights from their observability strategy, and keep costs manageable.
But what they gained from migrating to Grafana Cloud and working with Grafana Labs was much more. “The engineering team is super sharp. They’re experts. This is the best of the best," said Omar Lopez, head of the observability team from SailPoint. “It really shows through the product itself, but also in the support we get when we have questions or we need solutions.”
When Javier Valencia, IT Architecture Manager at Kushki, worked on migrating from the company’s existing observability platform to Grafana Cloud, he felt the same level of support. “With Grafana Cloud, we had a provider that helped us throughout the whole process,” said Valencia. “It was a win-win.”
In this blog post, three global companies talk about the wins they experienced after moving to Grafana Cloud at critical moments of scale — and how the Grafana Labs team played a big role in achieving their goals.
1. A powerful, unified view
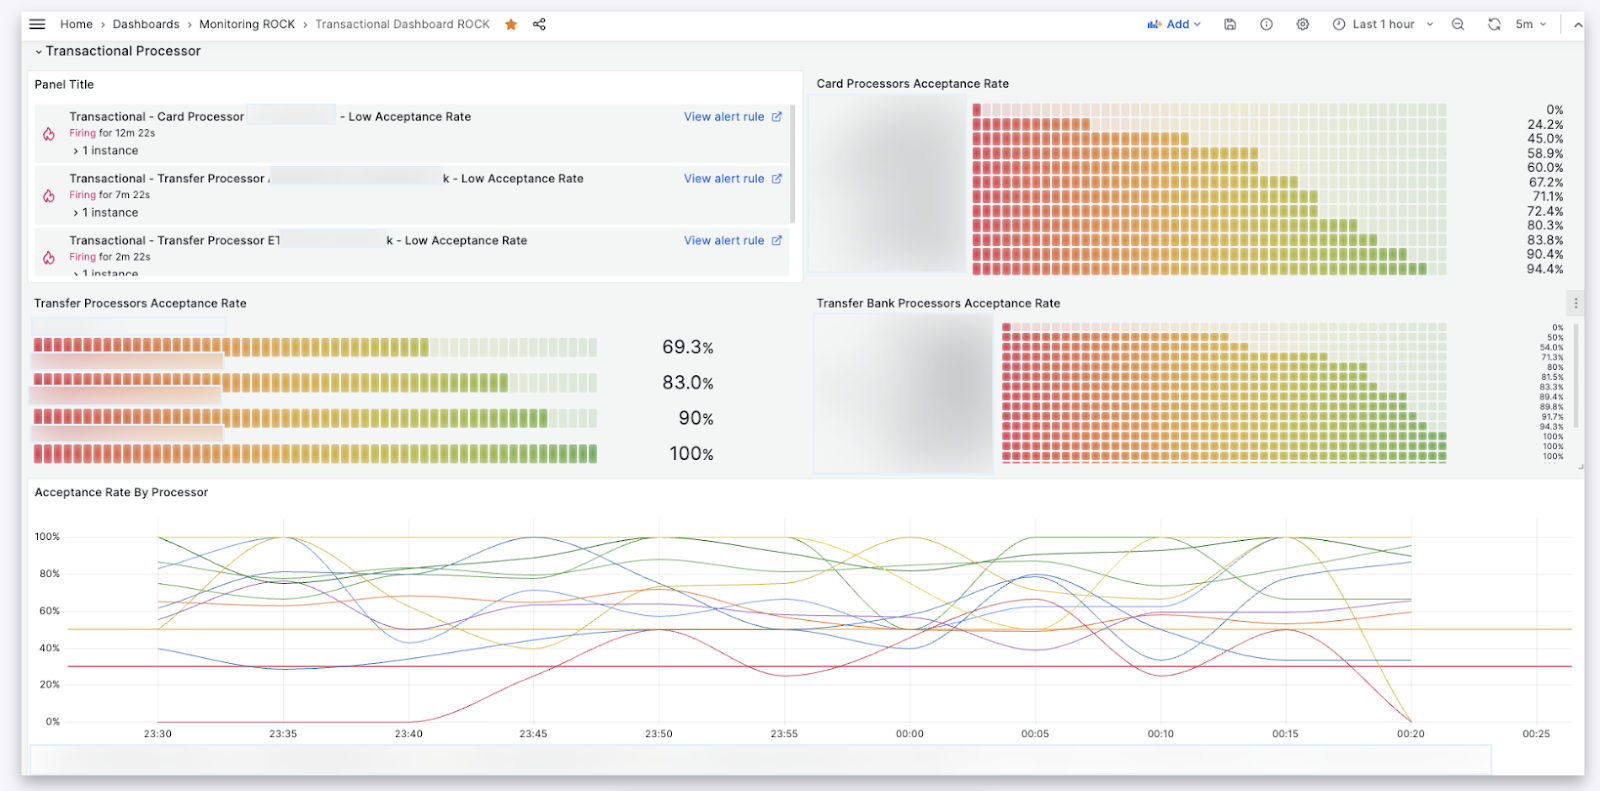
For Kushki, a fast response is critical. As a leading digital payments provider in Latin America, they manage secure electronic transactions for hundreds of customers in the region. To monitor these transactions and any failures comprehensively, they turned to Grafana Cloud.
“We had a tool to see technical issues, another tool to see business issues, and those were separate from our visualization tool,” said Valencia. “So the principal goal we had was to identify a single tool that would give us a complete view into our systems. We also wanted to better understand the real reason behind why a transaction wasn’t successful — Was it a technical cause? A business cause? A change from the dev team?”
Leveraging Grafana Cloud’s extensive network of more than 100 data source plugins, Kushki seamlessly integrated data from MongoDB, Prometheus, AWS XRay, and Amazon CloudWatch to create a unified monitoring solution.

Now, they can “visually understand the transaction flow in one place,” said Giacomo Orizzonte, Cloud Infrastructure Manager at Kushki. Additionally, they use Grafana Alerting to configure multi-dimensional alerts, optimizing response times. (They instantly reduced API response time by three seconds.)
Along with the observability gains, the Kushki team valued the transparency the Grafana Labs team brings to the table. “Grafana Labs was honest about their development process,” said Valencia. “The clarity of what features are in the roadmap was very important to us.”
And they liked what they saw. Said Orizzonte: “The future is great with Grafana.”
For more on Kushki’s journey with Grafana Cloud, read their success story.
2. A support system for your systems
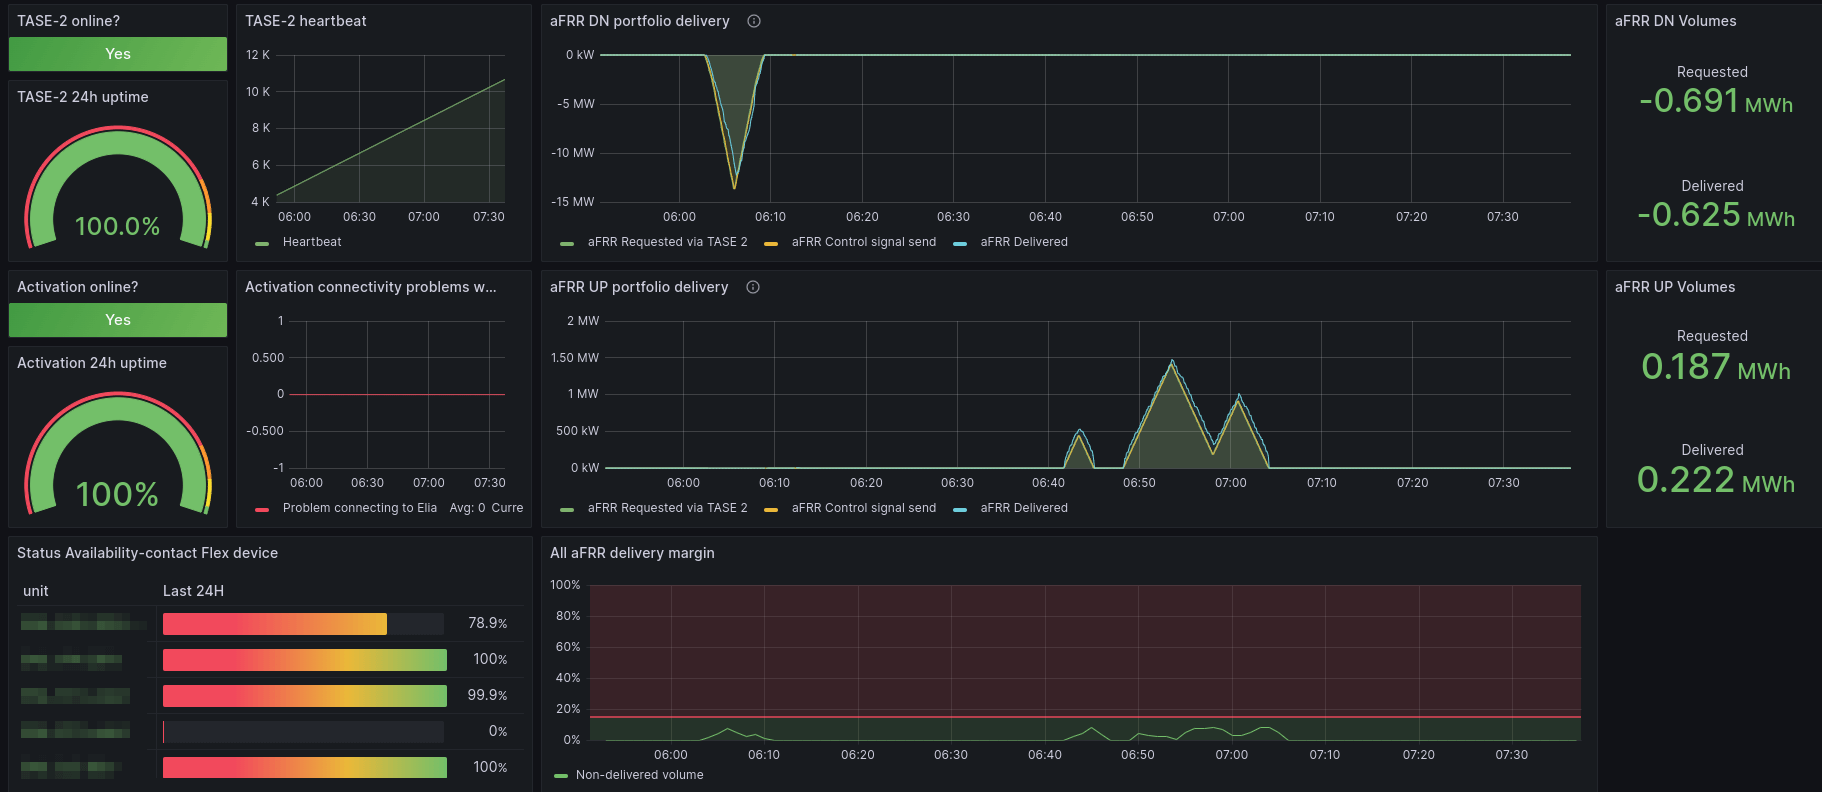
Flexcity, a pioneer in electric flexibility solutions, encountered a monumental challenge during the winter of 2022: stabilizing the French national power grid amidst a widespread energy crisis in Europe. To navigate this unprecedented task, Flexcity turned to Grafana Cloud, leveraging its dynamic dashboards to monitor real-time energy and power consumption and production levels across their customer base.
Mathias Deshayes, CTO at Flexcity, underscored the benefits of Grafana Cloud’s managed services, noting regular security updates without server maintenance — a significant improvement over their OSS stack. They also utilized the platform’s white-labeling capabilities, tailoring dashboards to their customers. Additionally, the integration of Google single sign-on streamlined user management.

Beyond the technical advantages, Flexcity was impressed by the exceptional support provided by Grafana Labs. “We have a dedicated customer support contact in Paris,” Deshayes said. “We have a bi-weekly meeting with him, which is very helpful.” The added resource also allows Flexcity to explore new features with ease, said Deshayes: “There is less stress, and more confidence overall, during activations now with Grafana.”
To learn more, check out the full story behind Flexcity’s observability journey.
3. Lower TCO while continuing to scale
SailPoint, a leader in identity management solutions, struggled to manage an ever-scaling Prometheus deployment, which took significant manual effort and resulted in rising bills.
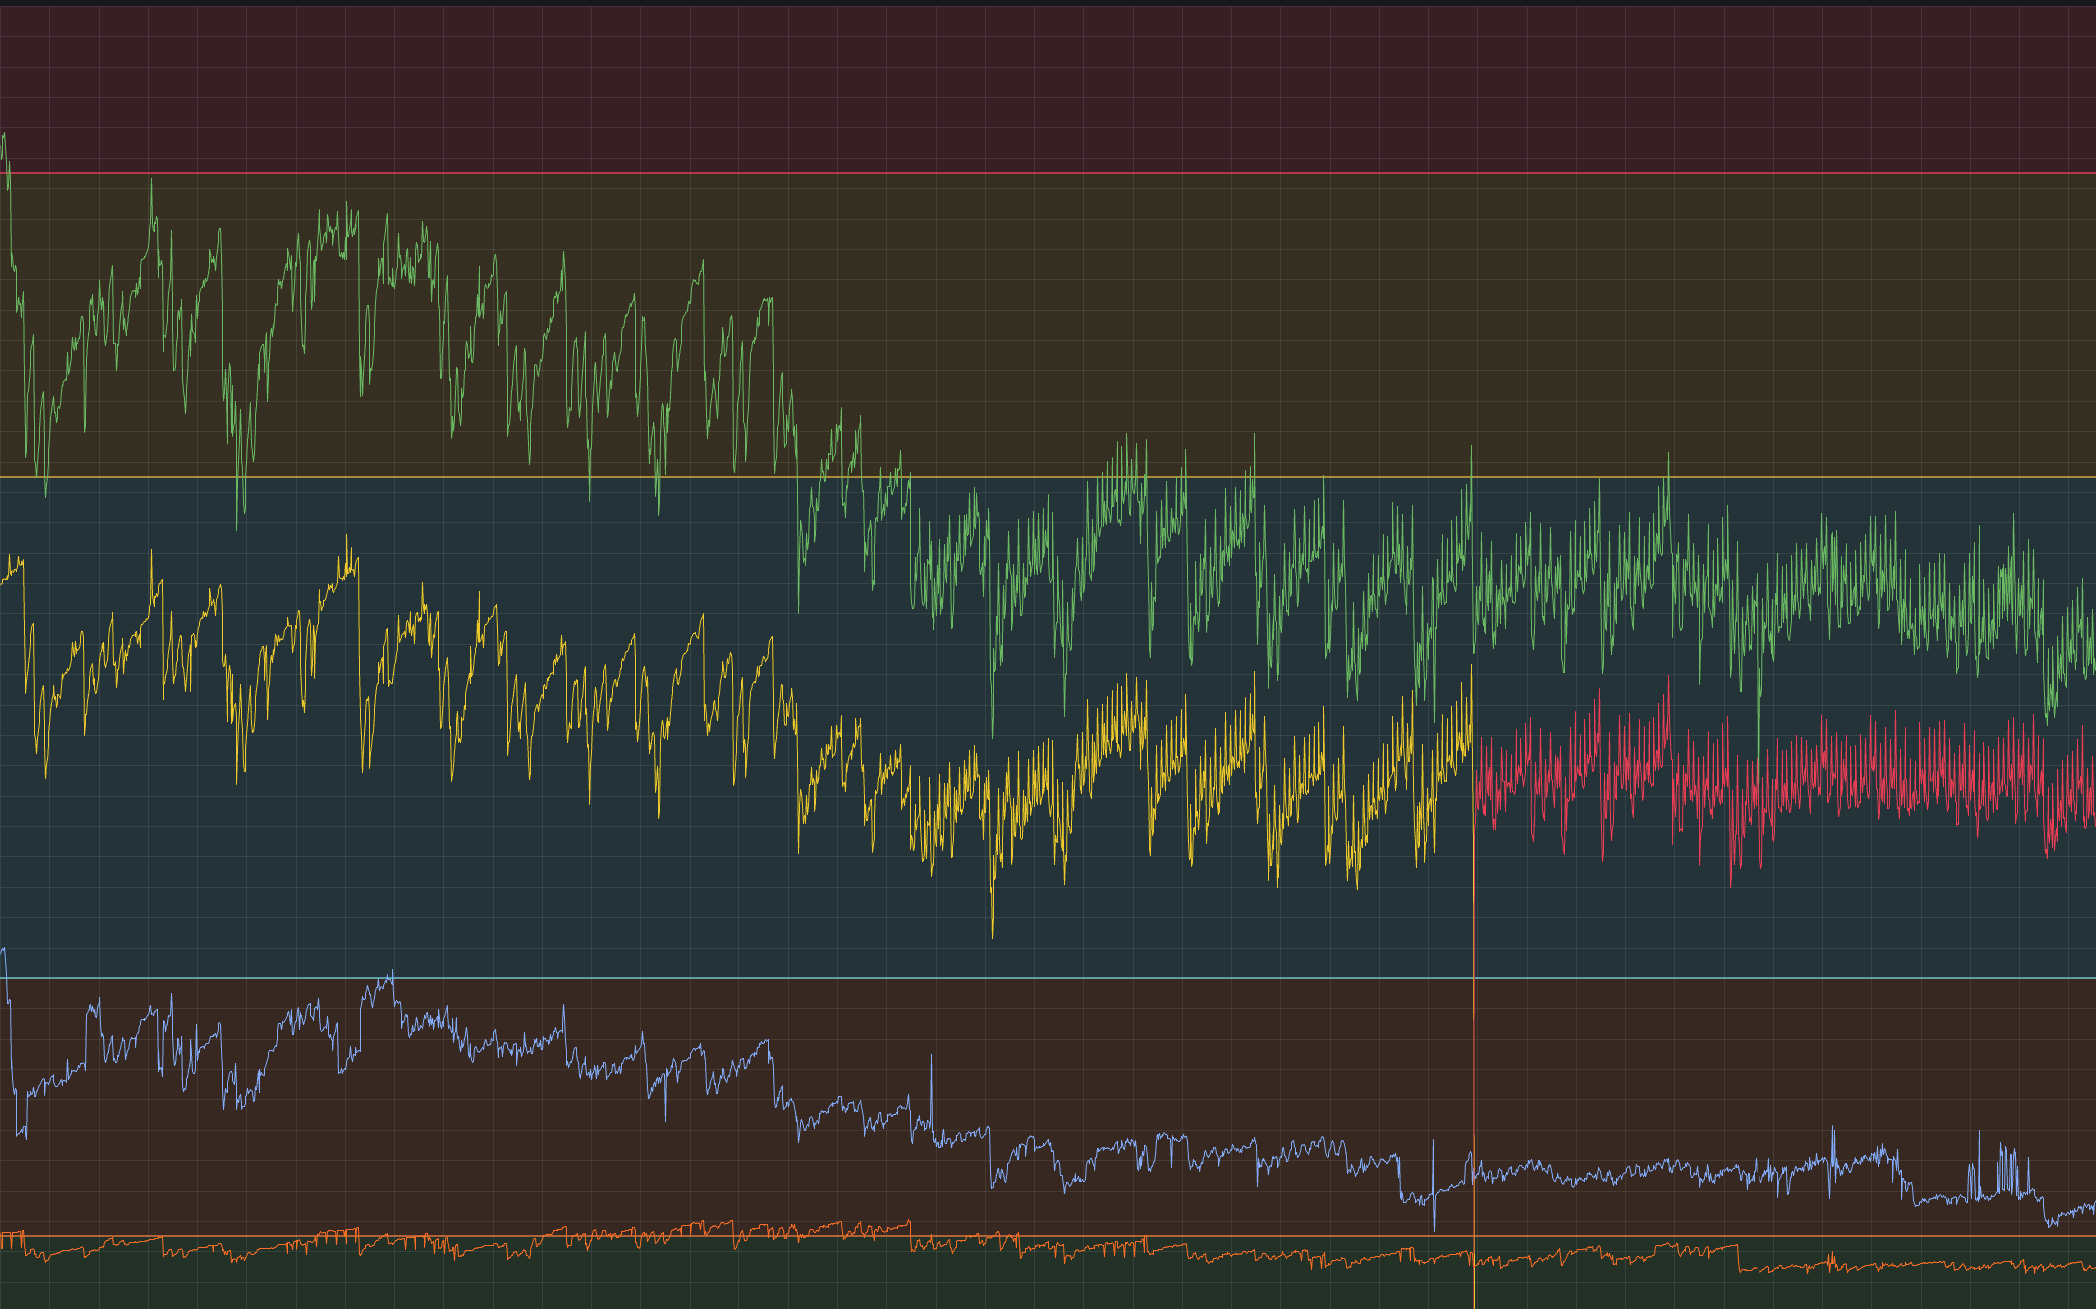
That all changed with Adaptive Metrics, the metrics management feature in Grafana Cloud that enables teams to aggregate unused and partially used metrics into lower cardinality versions of themselves to reduce costs. Within a few months of applying Adaptive Metrics aggregation suggestions, in combination with internal efforts within the engineering team, SailPoint reduced their metrics volume by 33%.

“Adaptive Metrics really helps us to grow efficiently from here on out, without just blowing up our metrics and our costs,” said Omar Lopez, SailPoint’s head of observability. “When we crunched the numbers, Grafana Labs was offering to run everything for cheaper, and it would reduce the load on our engineering team. That was our ‘a-ha’ moment.”
After finding success with Grafana Cloud Metrics, they decided to migrate from Grafana OSS to Grafana Cloud for visualization and monitoring. And they’re eager to add more to their Grafana Cloud stack. Calling the Grafana Labs engineering team “just phenomenal,” Lopez said, “When they release a new tool or they have logs, tracing, or all other aspects of observability, there’s going to be some good engineering thought behind it, and it’s worth looking at and considering.”
And that’s exactly what his team now has more time to do. “We’re exploring more and more of the features and services in Grafana Cloud,” said Lopez. “It’s like being a kid in a candy store — we’re looking at everything.”
Find out more about Sailpoint’s observability stack.
Grafana Cloud is the easiest way to get started with metrics, logs, traces, and dashboards. We have a generous forever-free tier and plans for every use case. Sign up for free now!


