

A guide to scaling Grafana Alloy deployments across multiple hosts
Last week we introduced Grafana Alloy, our distribution of the OpenTelemetry Collector with built-in Prometheus pipelines and support for metrics, logs, traces, and profiles. We’re excited to see the community embrace Alloy, and we want to help them use and scale it as easily as possible.
Many developers that need to deploy and manage software across several hosts turn to Ansible for its ease of use and versatility. That also makes Ansible an excellent choice for deploying Grafana Alloy, as it simplifies the automation of installation, setup, and management tasks related to Alloy.
In this guide we’ll walk you through how to use the alloy role with the Grafana Ansible collection to deploy and manage Alloy across multiple Linux hosts. We’ll then show you how to explore your data in Grafana.
Before you begin
To get started, you should have the following:
- Linux hosts with SSH access and sufficient permissions
- Ansible installed on your base system
Install the Grafana Ansible collection
The Alloy role is available in the Grafana Ansible collection as of the 4.0.0 release.
To install the Grafana Ansible collection, run this command:
ansible-galaxy collection install grafana.grafana:4.0.0Create an Ansible inventory file
Next, you will set up your hosts and create an inventory file.
- Create an Ansible inventory file.
An Ansible inventory, which resides in a file named inventory, lists each host IP on a separate line, like this (8 hosts shown):
146.190.208.216    # hostname = ubuntu-01
146.190.208.190    # hostname = ubuntu-02
137.184.155.128    # hostname = centos-01
146.190.216.129    # hostname = centos-02
198.199.82.174      # hostname = debian-01
198.199.77.93        # hostname = debian-02
143.198.182.156    # hostname = fedora-01
143.244.174.246 # hostname = fedora-02Note: If you are copying the above file, remove the comments (#).
- Create an
ansible.cfgfile within the same directory asinventory, with the following values:
[defaults]
inventory = inventory  # Path to the inventory file
private_key_file = ~/.ssh/id_rsa   # Path to my private SSH Key
remote_user=root
Use the Alloy Ansible role
Next you will create an Ansible playbook that calls the alloy role from the grafana.grafana Ansible collection.
To use the Alloy Ansible role:
- Create a file named
deploy-alloy.ymlin the same directory asansible.cfgandinventoryand add the configuration below.
- name: Install Alloy
  hosts: all
  become: true

  tasks:
    - name: Install Alloy
      ansible.builtin.include_role:
        name: grafana.grafana.alloy
      vars:
        config: |
          prometheus.scrape "default" {
            targets = [{"__address__" = "localhost:12345"}]
            forward_to = [prometheus.remote_write.prom.receiver]
          }
          prometheus.remote_write "prom" {
            endpoint {
                url = "<YOUR_PROMETHEUS_PUSH_ENDPOINT>"

                basic_auth {
                username = "149xxx"
                password = "glc_xxx"
              }
            }
          }
The playbook calls the alloy role from the grafana.grafana Ansible collection.
The Alloy configuration in this playbook sends metrics from the Linux hosts to your Prometheus data sources.
Refer to the Grafana Ansible documentation to understand the other variables you can pass to the alloy role.
- To run the playbook, run this command:
ansible-playbook deploy-alloy.ymlNote: You can place the
deploy-alloy.yml,ansible.cfg, andinventoryfiles in different directories based on your needs.
Check that metrics are being ingested into Prometheus
Metrics will soon be available in Grafana if your Prometheus data sources are added.
To test this, use the Explore feature. Click the Explore icon (compass icon) in the vertical navigation bar.
To check metrics:
- Find the Explore section. Look for the Explore icon (it looks like a compass) on the left-side vertical navigation bar in Grafana and click it.
- Select Your Prometheus data source. At the top of the page, there’s a dropdown menu. Use it to pick the Prometheus data source you’ve added.
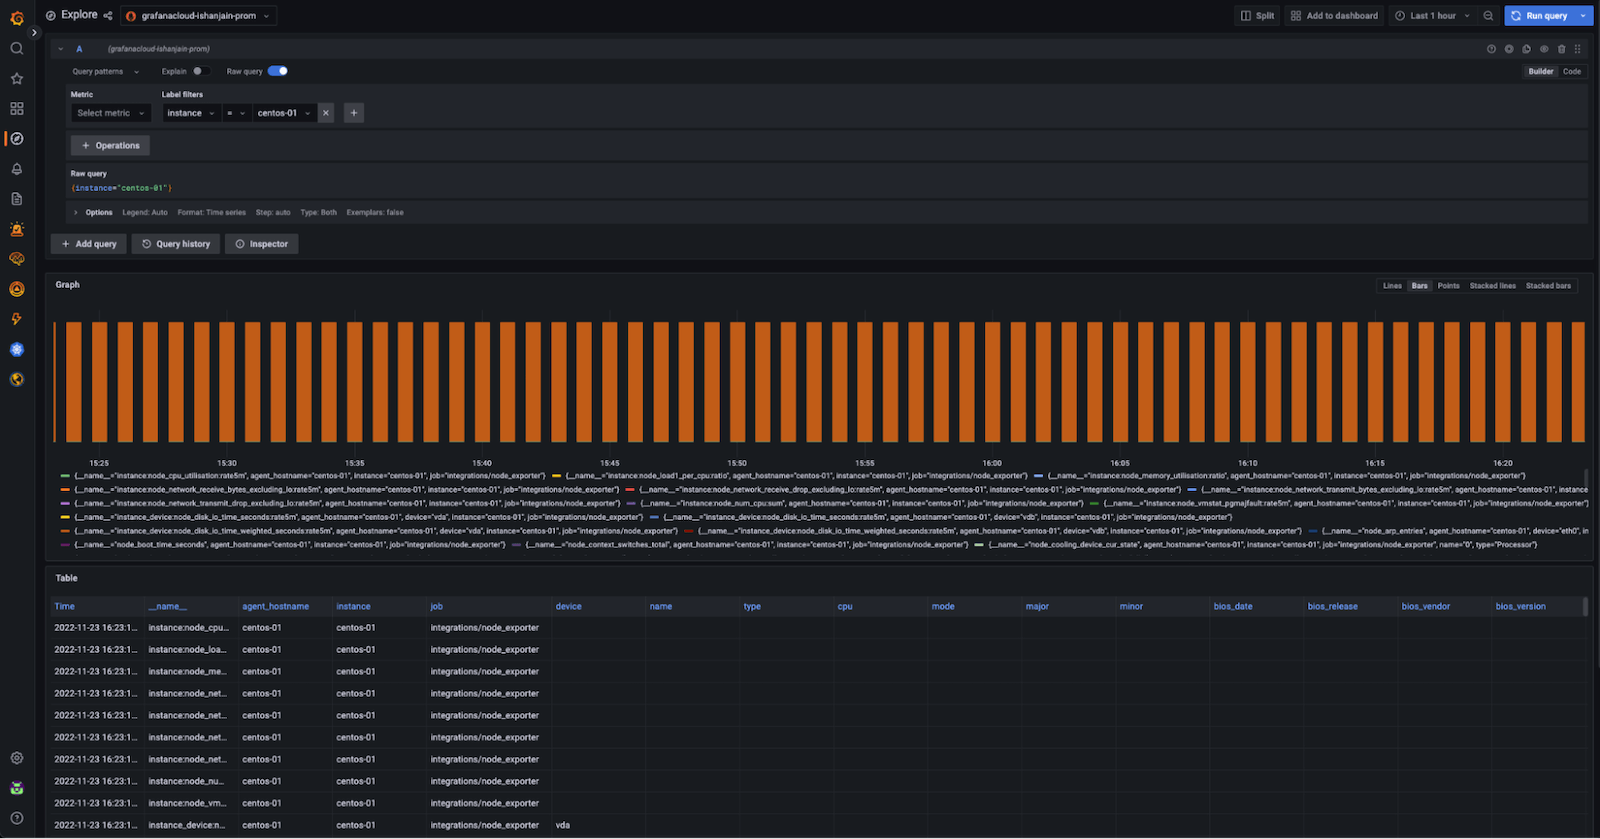
- Run a test query. Type in the query
{instance="centos-01"}, where"centos-01"should be replaced with the hostname of one of your Linux hosts. This is just an example to get you started, so change it to match your actual hostname. - Check metrics. After running the query, if you see a graph and a table with data (similar to the example shown in the image below), it means your metrics are correctly being fetched and displayed.
- Explore additional metrics. Explore other metrics—like CPU load, memory usage, disk IO, network bandwidth—and create dashboards to gain insights into your system’s performance.
If you don’t see any data, it could mean that metrics aren’t being collected as expected. To troubleshoot, check the status of your Alloy service by running this command:
sudo systemctl status alloy.serviceIf the Alloy service isn’t running, there might be an issue with the configuration syntax, or you might need to debug further. For help with this, take a look at the documentation available on configuring Alloy correctly and troubleshooting common issues.
Next steps: Set up clustering
Once you’ve got Grafana Alloy up and running across various Linux hosts, the next step to enhance its performance and reliability is to configure it for clustering. This setup lets individual Alloy instances collaborate, sharing workloads efficiently and ensuring your monitoring system remains available even under high demand.
For detailed guidance on how to configure Alloy for clustering, including step-by-step instructions and best practices, refer to our documentation.
Grafana Cloud is the easiest way to get started with metrics, logs, traces, dashboards, and more. We have a generous forever-free tier and plans for every use case. Sign up for free now!


