
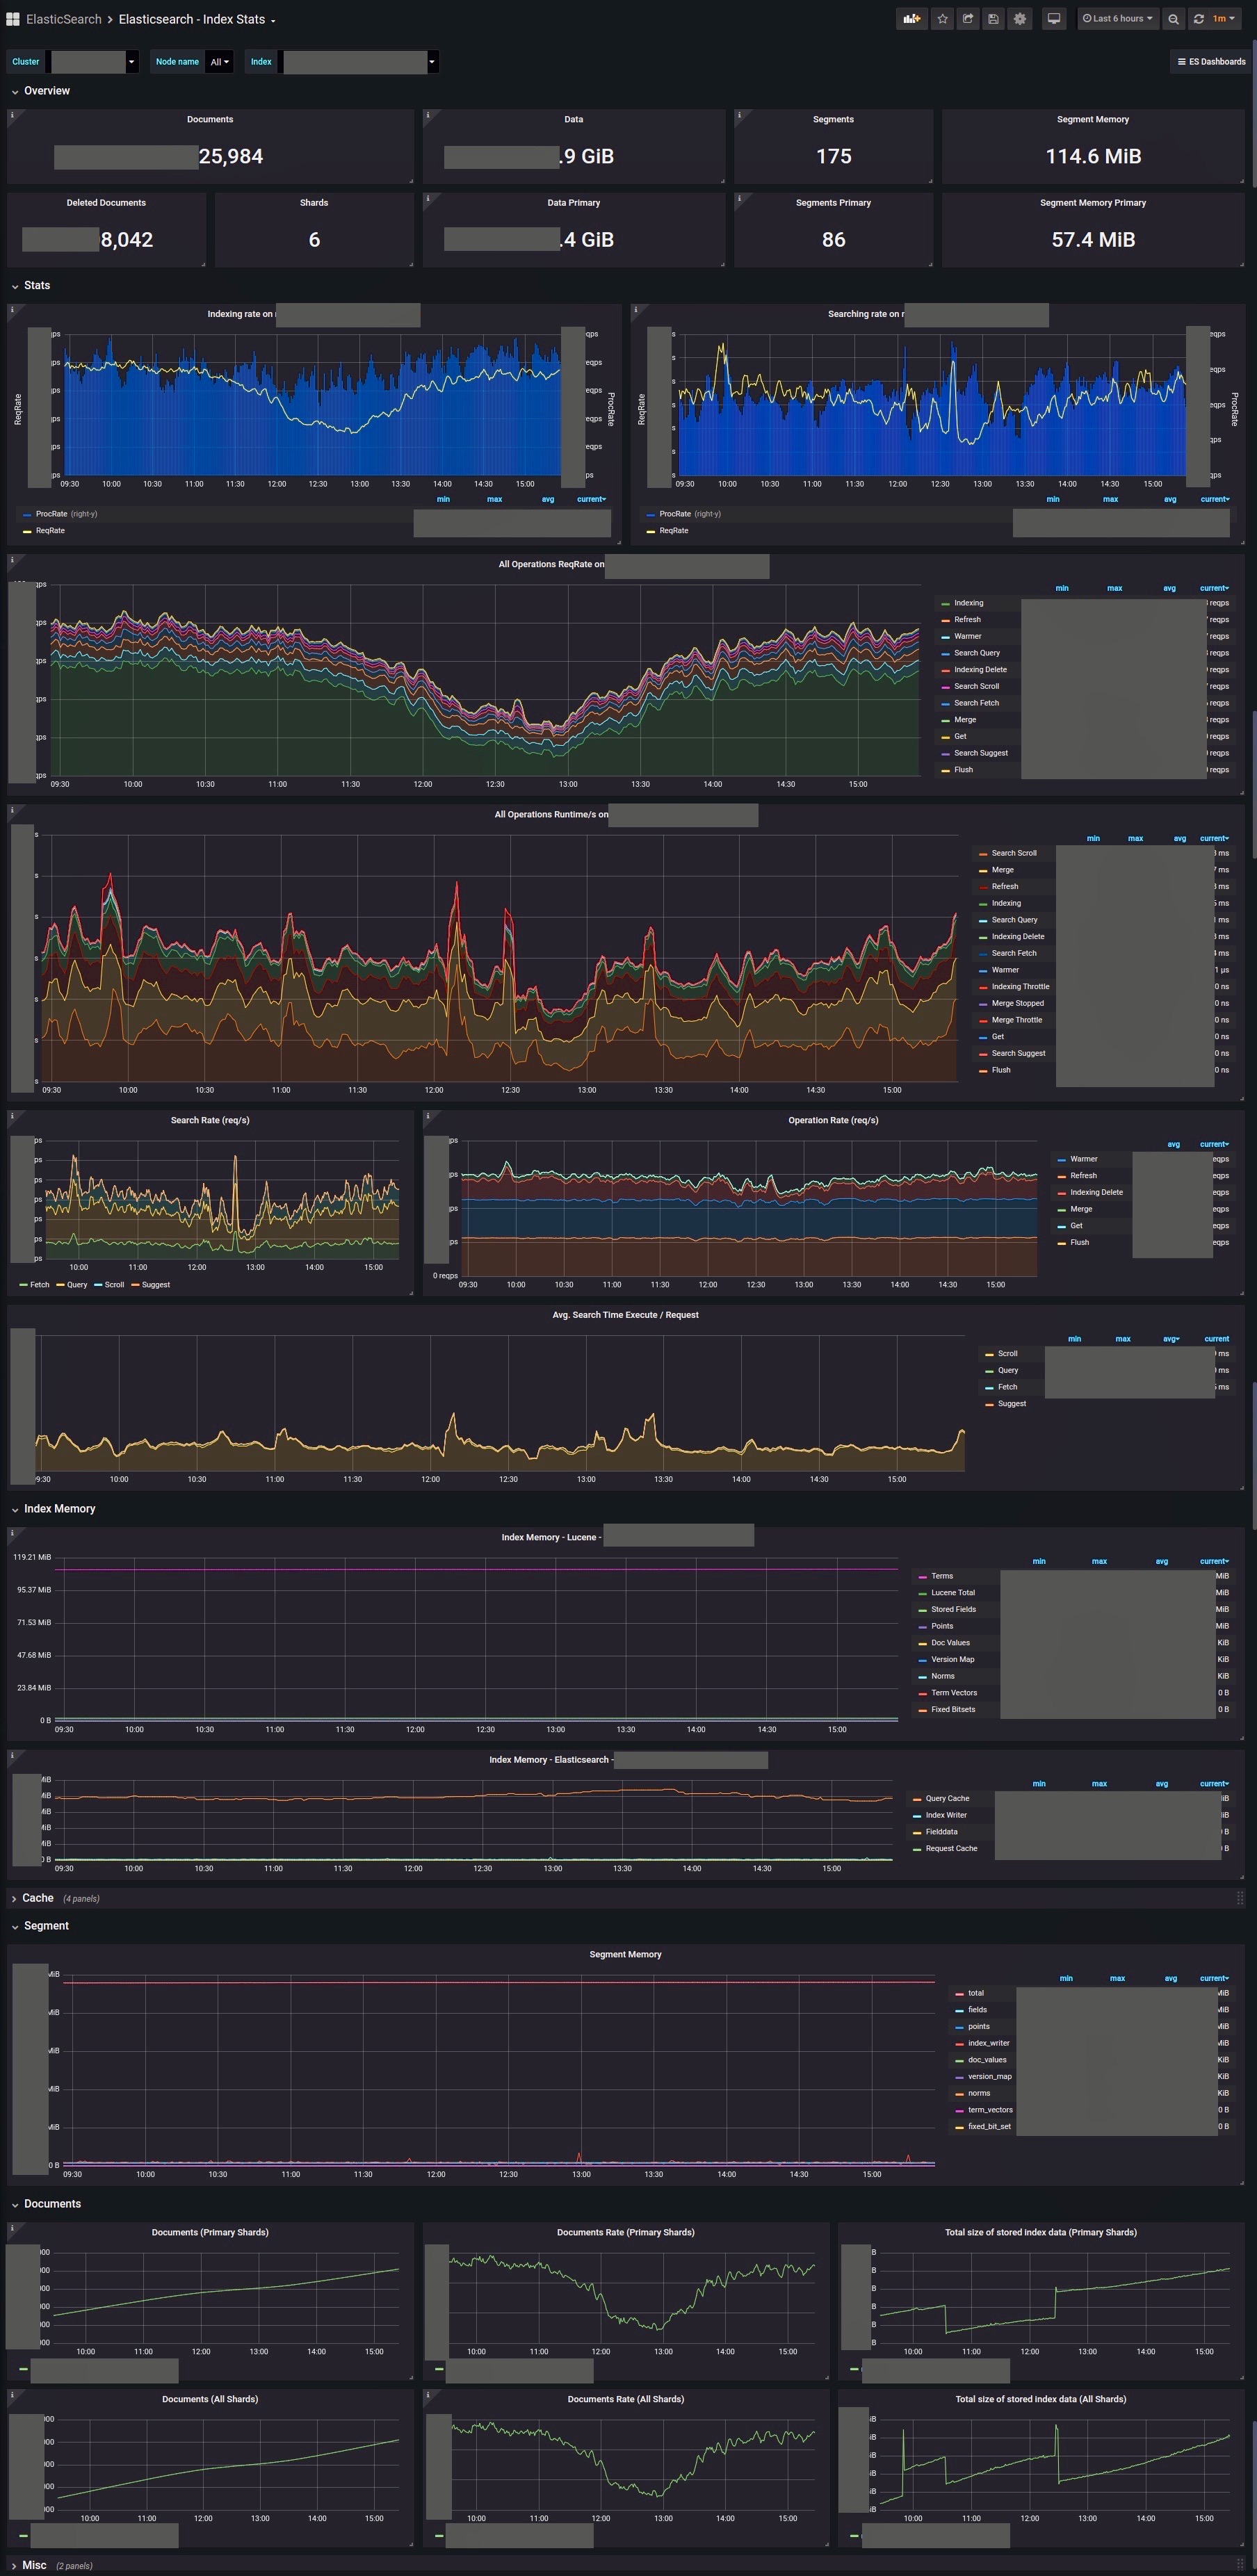
Elasticsearch - Index Stats
Grafana Dashboards for Elasticsearch using Prometheus Datasource. Dashboard for Index Stats.
grafana-dashboards-elasticsearch
Grafana Dashboards for Elasticsearch using Prometheus Datasource.
Please visit my GitHub at grafana-dashboards-elasticsearch for all dashboards related to this dashboard.
Requirements
- Datasource: Prometheus
- Exporter: Elasticsearch Exporter
Quickstart
My dashboards require Prometheus Datasource for mananging metrics, and Elasticsearch Exporter for crawling metrics from Elasticsearch Cluster and exposing these metrics. Prometheus is scheduled for pulling metrics from Elasticsearch Exporter.
I published my dashboards to Grafana Dashboards so you can easily import these dashboards to your Grafana.
13071: Dashboard for Elasticsearch Cluster Stats13073: Dashboard for Elasticsearch Node Stats13072: Dashboard for Elasticsearch Index Stats13074: Dashboard for Elasticsearch History Stats
Many thanks to https://grafana.com/grafana/dashboards/6483 and https://grafana.com/grafana/dashboards/2322
Screenshots
This is a screenshot of this dashboard. To view all screenshots, you can visit my GitHub for detail.
Changelogs
- 30/09/2020: first release with 4 dashboards, including Cluster Level Stats, Node Stats, Index Stats and History Stats
Data source config
Collector config:
Upload an updated version of an exported dashboard.json file from Grafana
| Revision | Description | Created | |
|---|---|---|---|
| Download |
Elasticsearch
Easily monitor Elasticsearch, a distributed, multitenant full-text search engine, with Grafana Cloud's out-of-the-box monitoring solution.
Learn more