What is Grafana Alloy?
Grafana Alloy is an open source OpenTelemetry collector with built-in Prometheus pipelines and support for metrics, logs, traces, and profiles.
Grafana Alloy overview
Grafana Alloy is Grafana Labs’ distribution of the OpenTelemetry Collector. It is an OTLP-compatible collector with built-in Prometheus optimizations that also supports signals across metrics, logs, traces, and profiles.
Alloy was started at Grafana Labs and announced at GrafanaCON in 2024. The mission for the project is to create the best “big tent” collector that’s compatible with the most popular open source observability ecosystems and includes enterprise-grade features to simplify operating at scale in a modern cloud native infrastructure.
Grafana Labs is proud to lead the development of the Alloy project, building first-class support for Alloy into Grafana and ensuring Grafana Labs customers receive Alloy support and features they need.
Why use Grafana Alloy as an OpenTelemetry collector?


How does Grafana Alloy work as an OpenTelemetry collector?
Collect
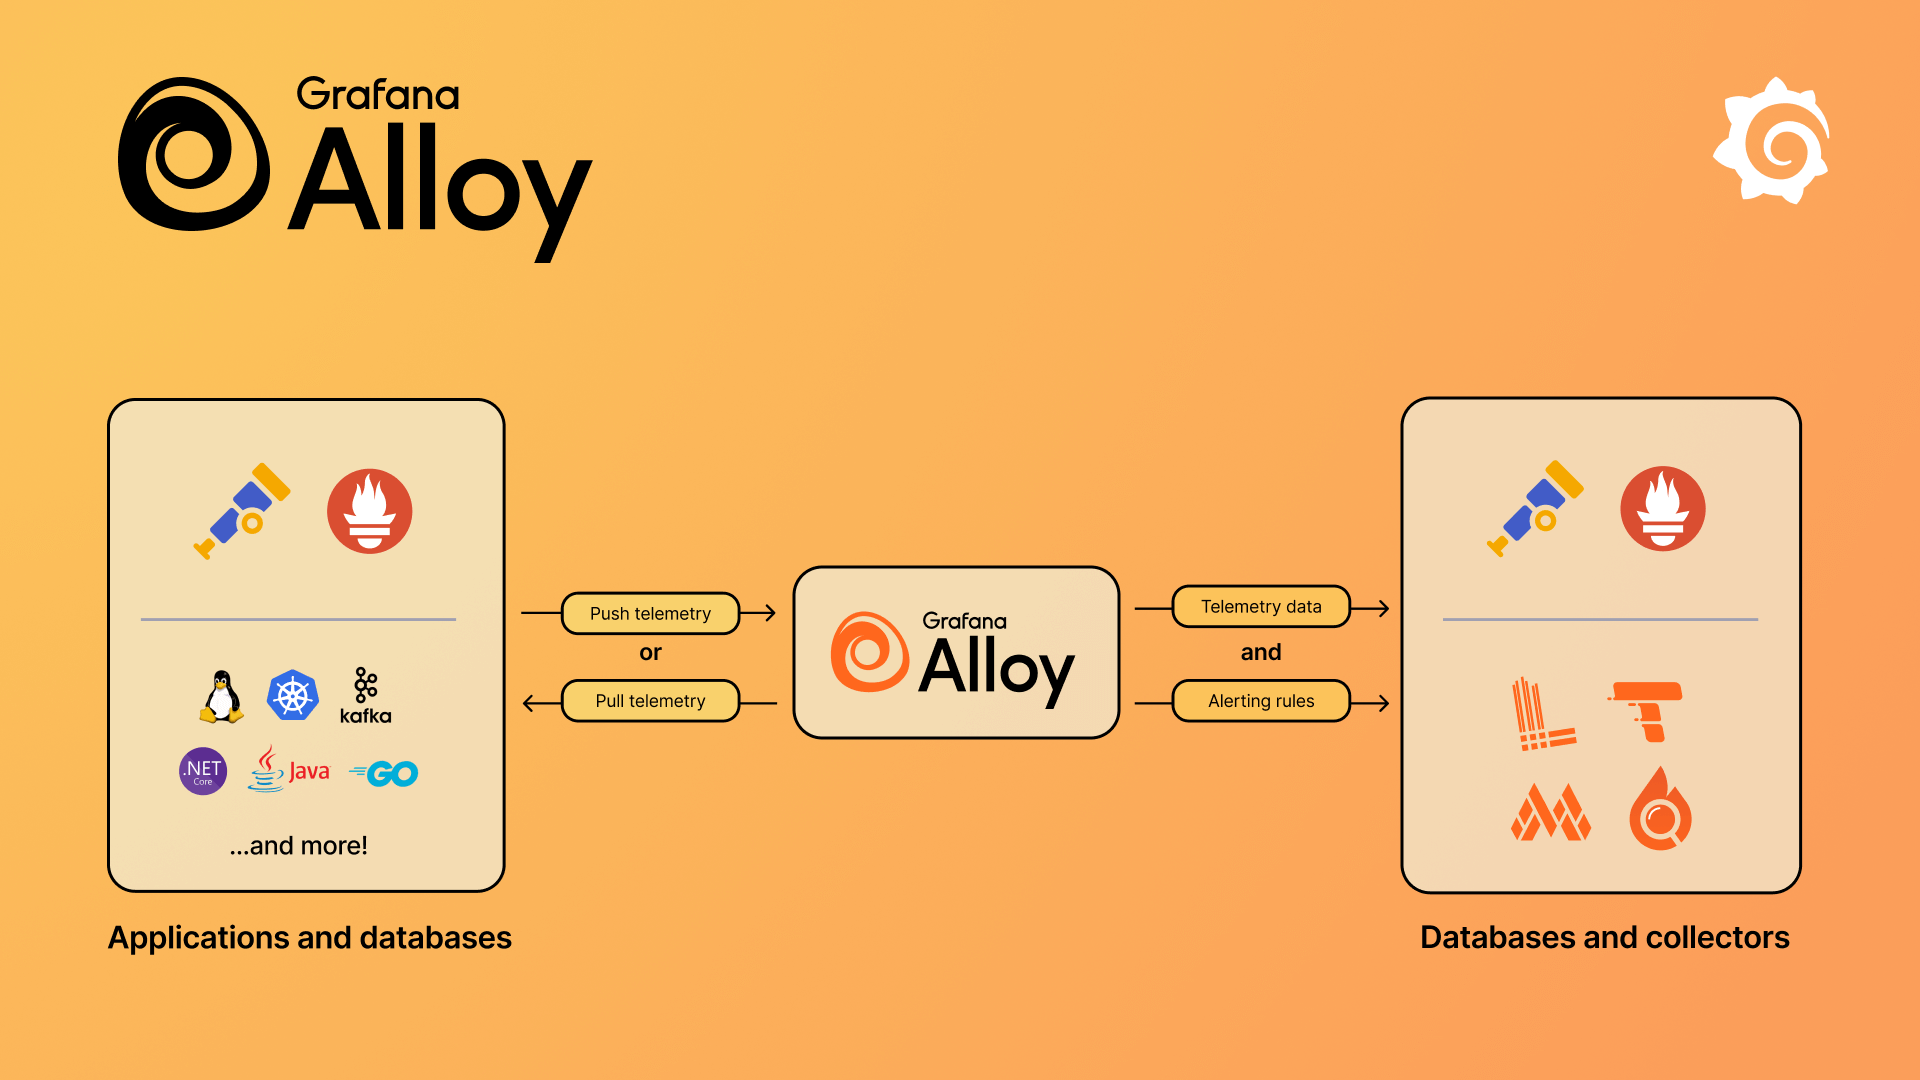
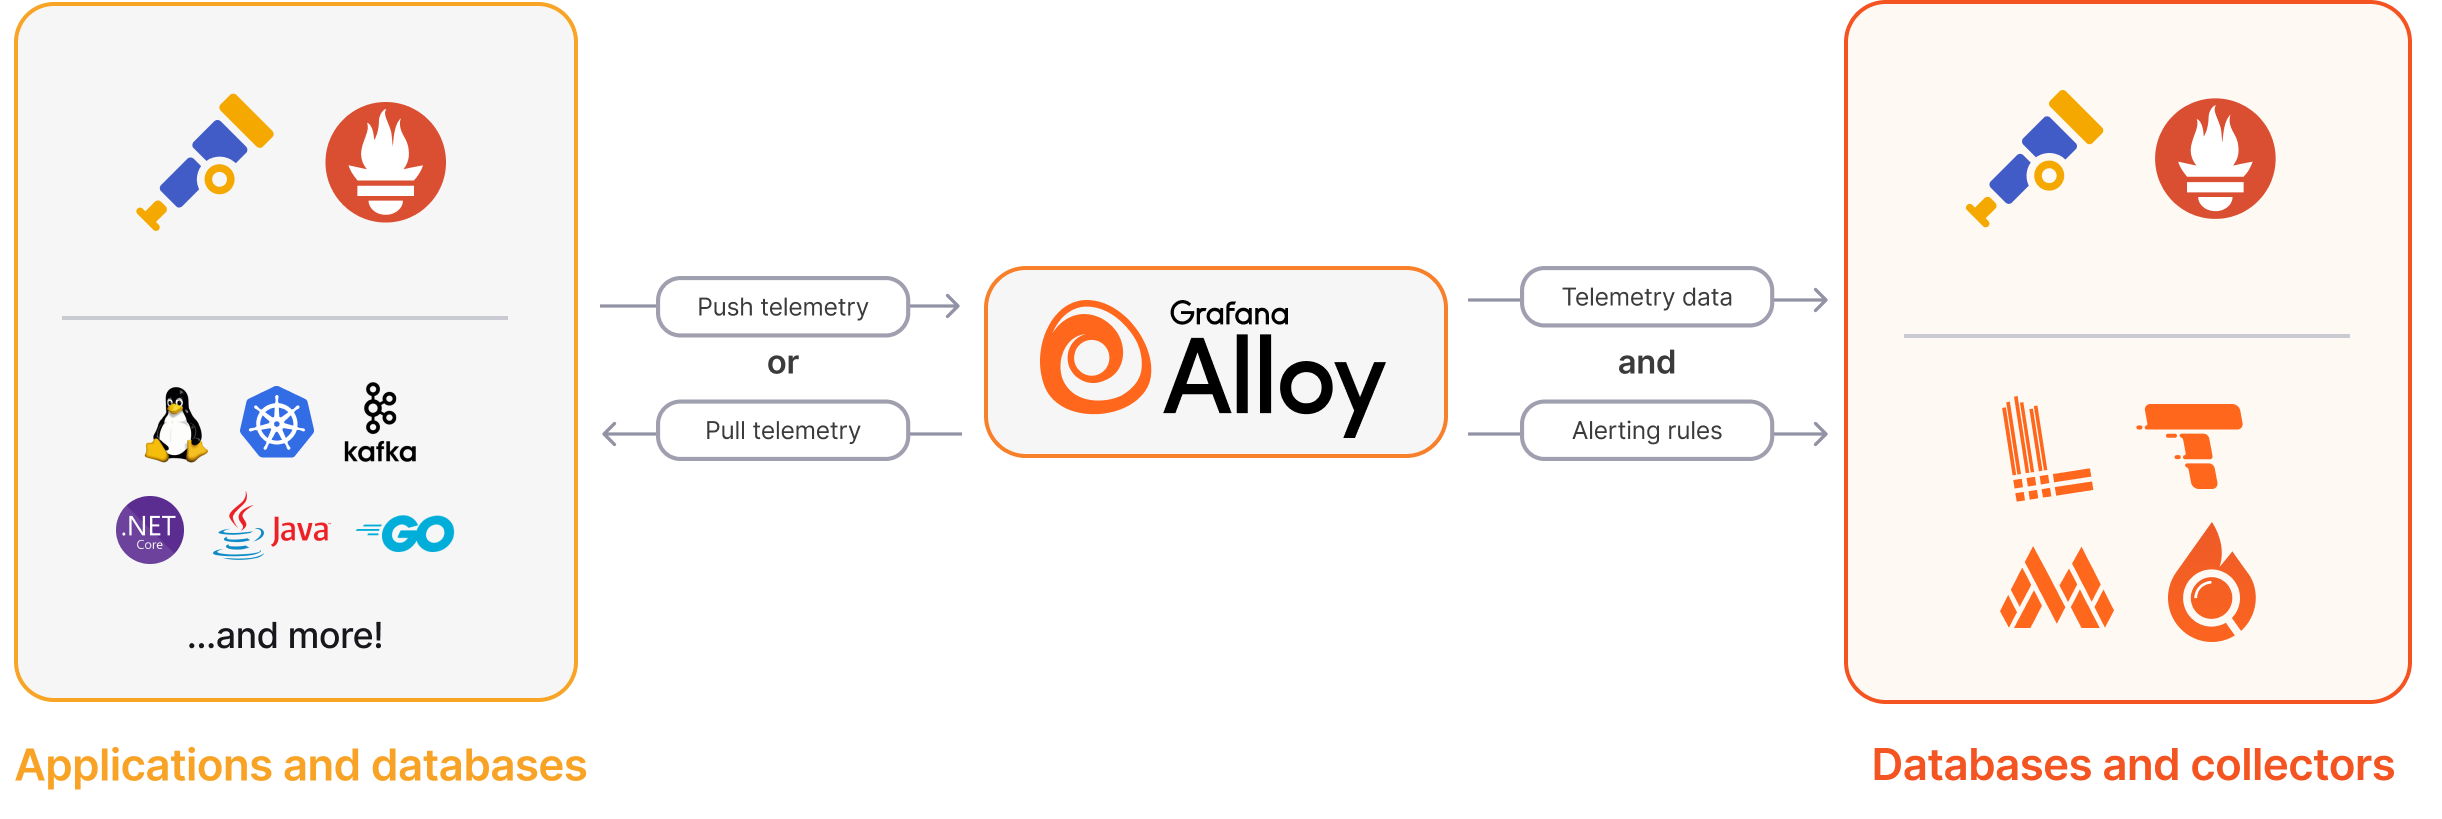
Grafana Alloy uses more than 120 components to collect telemetry data from applications, databases, and OpenTelemetry collectors. Alloy supports collection using multiple ecosystems, including OpenTelemetry and Prometheus.
Telemetry data can be either pushed to Grafana Alloy, or Grafana Alloy can pull it from your data sources.
Transform
Grafana Alloy processes data and transforms it for sending.
Transformations can be used to inject extra metadata into telemetry or filter out unwanted data.
Write
Grafana Alloy sends data to OpenTelemetry-compatible databases or collectors, the Grafana LGTM stack, or Grafana Cloud.
Grafana Alloy can additionally write alerting rules in compatible databases.
Choose the version that’s best for you
Grafana AlloyOpen source
Grafana CloudFree forever
Grafana Cloud ProPay as you go
Built on open source, driven by the community
We’re excited to share our learnings and work with the open source community on Grafana Labs’ distribution of the OpenTelemetry collector.